
October 2014, Vol. 69, No. 10
Newsline
CIGMAT Report 2014
The Center for Innovative Grouting Materials and Technology’s (CIGMAT) research is focused on energy, water and wastewater infrastructures and pipelines maintenance, environmental issues and developing new smart materials for construction, maintenance and repairs.
The CIGMAT Research Center is currently working on projects related to onshore and offshore applications. Some of the studies are focused on developing and characterizing smart cement and smart drilling mud for oil well construction and cementing applications, ultra deep water pipe-soil interaction, joint leak testing of polypropylene storm water pipes and nanotechnology.
In recent years, CIGMAT researchers have developed unique testing facilities including high pressure and high temperature (HPHT) testing of materials for oil and gas infrastructure applications and developed test protocols approved by EPA to test grouts, coatings and pipe joints for infrastructure rehabilitation. The Life Cycle Cost model (CIGMAT-LCC) for wastewater systems that is posted on the CIGMAT website is being used by cities, counties and the public. In the past two decades, over 60 commercial products including rapid repair materials, coatings, grouts, liners, cementitious and polymer composites and pipes have been researched and tested for number of applications. Also, the observed trends are analytically and numerically modeled to better understand the influence of various testing and environmental parameters. Every effort is being made by the CIGMAT researchers to transfer technology from control studies to actual applications. The director of CIGMAT is Dr. C. Vipulanandan (Vipu), P.E., professor of Civil Engineering, University of Houston, Houston, TX.
Ongoing research at CIGMAT is funded by federal, state and local agencies and industries. CIGMAT is currently working on a U.S. Department of Energy (DOE) funded project on developing smart cement and drilling mud for real-time monitoring of oil well installation and performance during the entire service life. Also several systems are being developed to monitor the performance of the cement sheath that is embedded between the casing and geological formations. In addition, research is being done on developing new hydraulic fracturing fluids using nanotechnology and condition assessment of water pipelines.
CIGMAT organizes an annual conference and exhibition on the first Friday in March on “Infrastructures, Energy, Geotechnical, Flooding and Sustainability Issues Related to Houston & Other Major Cities” at which speakers are invited from major cities, transportation authorities and energy industries around the country to present and discuss projects and problems related to construction, maintenance and rehabilitation issues. The conference also addresses the technical issues related to maintenance and rehabilitation of water and wastewater systems, nondestructive testing methods, oil wells and pipelines, hydraulic fracturing and development of smart materials for various applications. Geotechnical topics related to expansive clays, rapid construction of deep foundations and ground faulting are also discussed. The proceedings of the past 17 years of conferences are posted on the CIGMAT website at cigmat.cive.uh.edu. CIGMAT 2015 will be held on March 6, 2015. For conference details, visit cigmat.cive.uh.edu.
Smart Cement for Detecting Oil Based Mud Contamination
Oil well cement serves many purposes in the deep water drilling projects. It is important to form a sealing layer between the well casing and the geological formation referred to as the zonal isolation. With some of the reported failures and growing interest of environmental and economic concerns in the oil and gas industry, integrity of the cement sheath is of major importance. Oil based drilling mud (OBM) is one of the most commonly used muds used in well drilling. OBM contamination can have a severe impact on the cement performance in the wellbores. Contamination of cement with OBM will compromise the integrity of well cement, and cause disastrous failures. Studies reported in the literature indicate that OBMs, even at very low concentrations, are extremely detrimental to cement performance. Therefore, proper monitoring and tracking of the entire process of well cement becomes important to minimize damaging impact of contaminations. Limited studies have been done to characterize the effect of mud contamination on cement; however, monitoring the cement to detect the contamination and other properties during hydration has not been addressed.
In this study, oil well cement was modified to have better sensing properties, or smart cement, so that the behavior can be monitored at various stages of construction and during the entire service life of the oil wells. A series of experiments were performed to evaluate the behavior of oil well cements with and without modifications to identify the most reliable sensing properties that can also be easily monitored. For the cement, tests were performed from the time of mixing to hardened state behavior. During the initial setting of the cement, the electrical resistivity changed with time based on the type and amount of additives used in the cement. When the cement was modified with less than 0.1% of conductive additives, the piezoresistive behavior of the hardened smart cement was substantially improved without affecting the rheological properties and setting properties of the cement. For the piezoresistive smart cement, the resistivity change at peak stress was about 400 times higher than the change in the strain.
Effect of Contamination
Rheological Properties
It was evident from the rheological tests that both contaminated and uncontaminated smart cement slurries have shear-thinning behavior. OBM contamination reduced the rheological properties of smart cement. For instance, the viscosity of uncontaminated smart cement at a shear strain rate of 100 (1/sec) was 282 cp. At the same shear strain rate 0.1% OBM contaminated sample had viscosity of 204 cp. Contamination of smart cement with up to 3% OBM reduced the viscosity by more than 30% at the shear strain rate of 100 (1/sec). The viscosity was also reduced at higher shear strain rates with OBM contamination. The yield point of 0.1%, 1% and 3% OBM contaminated cement slurries was reduced by more than 37%, 25% and 22% respectively. The Bingham plastic relationship for uncontaminated and contaminated smart cement also showed a reduction in both yield point and plastic viscosity. This is because of the lower friction in contaminated slurries due to the lubricating effect of OBM.
Initial Resistivity
Electrical resistivity of uncontaminated and contaminated smart cement immediately after preparing the sample is shown in Figure 1. The initial electrical resistivity of the smart cement increased with increase in the mud contamination. The average initial electrical resistivity of uncontaminated smart cement was 1.06 Ω.m. Contaminating the smart cement with only 0.1 percent of OBM increased its initial electrical resistivity to 1.95 Ω.m which was 84 percent higher than the uncontaminated cement. When the smart cement was contaminated with 1% and 3% OBM, the increment in initial electrical resistivity was more than 216% and 304% respectively. Hence, electrical resistivity was highly sensitive to OBM contamination, and initial electrical resistivity of smart cement was a good indicator of OBM contamination.
Initial electrical resistivity of uncontaminated and contaminated smart cement.

Compressive Strength
The compressive strength of uncontaminated smart cement was 1.4 ksi and 3.5 ksi after one day and 28 days of curing. As shown in Figure 2, compressive strength of OBM contaminated smart cement was depended on the amount of contamination. Compressive strength appears to be inversely proportional to the amount of OBM contamination. For example, 0.1% and 3% OBM contamination reduced the one-day compressive strength of cement by over 40% and 75% compared to the uncontaminated smart cement. After 28 days of curing, the compressive strength of 0.1% and 3% OBM contaminated smart cement was reduced by over 25% and 35% respectively as compared to the uncontaminated cement.
Variation of compressive strength with curing time for OBM contaminated smart cement.
Resistivity and Compressive Strength
Compressive strength and electrical resistivity development depends on the hydration process. OBM contamination reduced the compressive strength and the changed the electrical resistivity index (RI24) in all of the samples studied. Of the various resistivity parameters, the maximum resistivity change in the initial 24 hours (RI24) had a direct correlation with the compressive strength of smart cement for each curing time (1, 7 and 28 days) with and without contamination. The relationship between the change in electrical resistivity index (RI24) and the compressive strengths for various curing times are shown in Figure 3. Hence, using the resistivity index RI24, the strength of the uncontaminated and contaminated smart cement could be determined.
Relationship between compressive strength and Resistivity index for uncontaminated and OBM contaminated smart cement.

Hydraulic Fracturing Fluid Modified with Nano Silica Proppant
Hydraulic fracturing, which started in United States in late 1940s, is a technique used in various applications including the petroleum industry to free oil and natural gas trapped underground in low permeability rock formations by injecting a fluid under high pressure in order to crack the formations. The composition of a fracturing fluid varies with the nature of the formation, but typically contains 99% of water and proppant sand to keep the fractures open and a small percentage of chemical additives. The quality of fracturing fluid can be effectively maintained by continuously measuring fluid characteristics in the field and controlling its viscous properties by modifying fluid additives and injection rate. Minimizing formation damage and fracture damage is regarded as a unique goal of hydraulic fracture design.
In the United States, shale gas and oil production has grown rapidly in the past years with continuous technological developments in hydraulic fracturing. Hydraulically fracturing rocks increases the permeability by opening, connecting and keeping open pre-existing or new fractures in the formation. The design of the fracturing fluid is therefore critical for the success of the operation. Its main function is to open the fractures and to transport and keep the proppant along the length of the cracked rocks. The rheological properties of the fluid are usually considered the most important parameters (Economides and Nolte 1989). However, the fracturing fluid must exhibit other important properties such as minimizing fluid loss and demonstrate low friction pressure during pumping (API RP39 1998). Also enhancing the sensing properties will help in monitoring the changes and contamination in various materials including fracturing fluids.
The composition of the fracturing fluid is important to not only fracture the rocks but also to provide for efficient transport and placement of proppant into fractured rocks to keep it opened to extract the oil and gas. In this study, the effect of 1% nano silica proppant on the rheological properties, fluid loss and electrical resistivity of the fracturing fluids and transport characteristics in the pre-cracked sandstone were investigated at various temperatures and pressures up to 85 degrees Celsius and 700 psi (splitting tensile strength of rock) respectively. Two different mixes of the fracturing fluids were developed and used in this study to investigate the effects of nano silica proppant. The amount of water in the fracturing fluid varied from 90% to 93% (by the total weight of the fracturing fluid) and the percentage of the fine sand used varied from 5% to 9% (by the weight of fluid) with 1% of guar gum. Additions of 1% of nano silica increased the electrical resistivity by 18% at room temperature. With increasing the temperature from 25 degrees Celsius to 85 degrees Celsius, the electrical resistivity of fracturing fluid with and without nano silica decreased from 4.56 to 3.11 Ω-m and from 3.75 to 2.78 Ω-m respectively.
Rock-Fracture Fluid Interaction
In this study, four different rock-fluid interaction tests were performed. The sandstone rock samples were saturated and pre-cracked using a splitting tensile test.
Room Temperature (T=25oC)
Test # 1: The fracturing fluid used in this test was 9% sand (Mix 1); the fracturing fluid was subjected to different pressures up to 700 psi at room temperature. The amount of fluid collected from the sample was 0 mL at 100 psi for 26 hours; by increasing the pressure to 500 psi and 700 psi, the discharge collected increased to 33 mL and 72 mL respectively. The permeability of the rock increased by 89% and 103% under pressure of 500 psi and 700 psi respectively as shown in Figure 4a.
Test # 2: The fracturing fluid used in this test was 1% nano silica and 5% sand (Mix 2) and the effect of adding 1% nano silica at room temperature was investigated. The amount of fluid collected from the sample was 0 mL at 100 psi after 22 hours; by increasing the pressure to 500 psi and 700 psi, the discharge collected increased by 36% and 27% respectively. The permeability of the rock also increased by 25% and 37% when the pressure changed from 100 psi to 500 psi and 700 psi respectively as shown in Figure 4a. Adding 1% nano silica increased the permeability of the rock at room temperature by 99%, 25% and 37% under 300 psi, 500 psi and 700 psi respectively as shown in Figure 4a.
Higher Temperature (T=85oC)
Test # 3: The fracturing fluid used in this test was 9% sand (Mix 1) at a temperature of 85oC. The amount of the fluid collected from the sample increased from 0 to 18 mL at 100 psi after 24 hours; by increasing the pressure to 500 psi and 700 psi, the discharge collected increased by 24% and 7% respectively. The permeability of the rock also increased by 25% and 37% when the pressure changed from 100 psi to 500 psi and 700 psi respectively as shown in Figure 4b.
Test # 4: The fracturing fluid used in this test was 1% nano silica and 5% sand (Mix 2) and the effect of the 1% nano silica at T=85oC was investigated. The amount of the fluid collected from the sample increased from 0 to 7 mL at 100 psi at 18 hours; by increasing the pressure to 500 psi and 700 psi, the discharge collected from the mid valve increased by 43% and 27% respectively. The permeability of the rock also increased by 25% and 37% when the pressure changed from 100 psi to 500 psi and 700 psi respectively as shown in Figure 4b. Adding 1% of the nano silica increased the permeability of the rock at T=85oC by 15%, 14% and 14% under 300 psi, 500 psi and 700 psi respectively as shown in Figure 4b.
Variation of permeability of the pre-fractured rock with pressure and temperature and fracturing fluids.


National Survey on the Trends in Small Diameter Water Pipeline Failures
Most of the water mains installed during the first half of nineteenth century were made of cast iron (CI) and ductile iron (DI) which currently have an average age of 50 to 75 years. Asbestos-cement (AC) pipes are also old pipes, which were introduced in the 1930s and are not used presently. The polyvinyl chloride (PVC) pipes were first introduced to North America in 1951 and are widely used today compared to CI, DI and AC pipes. PVC pipes have higher resistance to corrosion and can be used in very corrosive environments, but they are likely to be affected by deterioration if they were exposed to weather, chemical attack or mechanical degradation from improper installation methods. There are approximately 200,000 public water systems in the United States. The community water systems, estimated to be 30 percent of the public water systems, serves primarily residential areas and 90 percent of the U.S. population. These water distribution systems are approximately 863,000 miles (1,380,800 km) long with an annual rate of new installations estimated at 11,900 miles (19,040 km) and annual replacement rate estimated at 4,100 miles (6,560 km) (AWWA 1998).
It has been reported that the water pipelines in North America are rapidly approaching the end of their useful lives and a substantial amount of water is lost daily due to underground pipeline leakage and breaks. It has been estimated that in the U.S., on a daily basis, there are 700 water pipeline breaks and an estimated water loss of 7 billion gallons per day (ASCE Smart Brief 2012). In the United States, the cost of replacing all water mains would be as much as $348 billion, while only upgrading would cost $77 billion over the next 20 years. The EPA, based on the Clean Water and Drinking Water Infrastructure Gap Analysis, estimated that utilities will need to invest about $300 billion over the next two decades on repairs and improvements in the drinking water systems. In addition, the 2011 ASCE infrastructure report card gives an overall grade of D- for the drinking water infrastructure system and there is a shortfall of at least $11 billion a year to replace, upgrade and maintain the aging water facilities that are near the end of their useful lives, and to comply with the existing federal regulations (ASCE Smart Brief 2012).
A national survey was conducted during the years 2008-09 by the CIGMAT in collaboration with the city of Houston to document the conditions of small diameter (< 500 mm diameter) water pipelines in the United States and Canada. Several major cities and a few smaller cities participated in the survey, representing a population of 11 million and a water pipeline length of over 28,000 miles with pipe diameters less than 500 mm. The survey results were analyzed with a number of local parameters to establish the general trends observed in the water pipeline failures. The results were also compared to the one conducted by the U.S. Council of Mayors (USCM) in 2007. The survey conducted by USCM included over 290 cities representing a population of more than 30 million with water pipeline length of over 100,000 miles. By comparing the two surveys, the CIGMAT survey represented relatively larger water systems with several cities having total water pipeline length greater than 1,000 miles. Based on both surveys, the water pipeline breaks per day varied from 0.002 to 12. From the CIGMAT survey, it was possible to investigate the relationship between water pipeline breaks or breaks per mile with numbers of independent variables and the total pipe length in a city was an important parameter. In this study, few relationships were developed for water pipeline breaks using the CIGMAT survey data, and the predictions were compared to the USCM survey data.
Model the pipeline breakage
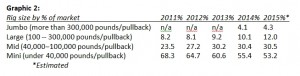
Based on the CIGMAT survey, the small diameter water pipeline (less than 508 mm) amounted to between 81% to 100%, with most cities having 90% of the system with small diameter pipelines as shown in Figure 2. However the USCM and NRC surveys did not show any information on the size of the pipe in the water system. Based on CIGMAT survey results, it was critical to establish relationships between water pipeline breaks and other important parameters, so as to better quantify the failures.
CIGMAT: It has been reported in the literature that length is a factor to the breaks but has not been quantified. Total length of pipelines in the system for the cities varied from 500 to 7,500 miles. The variation of daily breaks with pipe length for various cities is shown in Figure 5. Based on the analyses of the data, with the following nonlinear relationship better represented the variation (Figure 5):
PB=0.295e0.0005L (L≤7500 miles) (1)
where: PB = Average number of pipe breaks per day
L = Total length of pipelines in each city (mi) (≤ 7,500 miles).
The coefficient of correlation (R) was 0.77, which was among the highest of all the parameters investigated. Hence it can be concluded that total length of water pipelines in a city is an important parameter influencing the pipe breaks per day. The total length of pipelines included in this study was over 30,000 miles.
USCM: In this report, minimum and maximum values were reported based on the size of the cities (defined by range of population). The average minimum and maximum pipeline length were 394 to 451 miles respectively and the average breaks per day varied from 0.22 to 0.25. As shown in Figure 5, the range of USCM averages was very close to the smallest city in the CIGMAT survey with total water pipeline length of 500 miles. The nonlinear relationship (Eqn. (1)) also predicted the USCM averages very well.
Correlation between pipe length and average number of breaks per day.

Conclusion
CIGMAT research studies are focused on developing smart materials for various applications including drilling, oil well cementing and hydraulic fracturing. Also studies are focused on physical modeling of pipe-soil interaction simulating ultra deep water conditions and behavior of coating materials used as insulators of oil pipelines. The effects of various types of nanoparticles on the performance of material and microbial fuel cells are being investigated.

Comments