
October 2015 Vol. 70 No. 10
Features
CIGMAT Report

 by C. Vipulanadan, PhD, P.E., professor and director,
Center for Innovative Grouting Materials and Technology (CIGMAT) and
Texas Hurricane Center for Innovative Technology (THC-IT),
Department of Civil and Environmental Engineering, University of Houston
The focus of CIGMAT research is on energy, water, and wastewater infrastructure and pipeline maintenance, environmental issues, and developing smart materials for construction, maintenance and repairs.
The CIGMAT Research Center is currently working on projects related to onshore and offshore applications. Some studies are focused on developing and characterizing smart cement and drilling mud for oil well construction and cementing applications. Ultra deep water pipe-soil interaction, joint leak testing of polypropylene storm water pipes and nanotechnology are also included.
In recent years, CIGMAT researchers have developed unique testing facilities that include high pressure and high temperature (HPHT) testing of materials for oil and gas infrastructure applications. Research also develops test protocols approved by the EPA to test grouts, coatings and pipe joints for infrastructure rehabilitation. The Life Cycle Cost model (CIGMAT-LCC) for wastewater systems posted on the CIGMAT website is being used by cities, counties and the public. In the past two decades, over 60 commercial products have been researched and tested for a number of applications, including rapid repair materials, coatings, grouts, liners, cementitious and polymer composites and pipes. Also, the observed trends are analytically and numerically modeled to better understand the influence of various environmental and testing parameters. Every effort is being made by the CIGMAT researchers to transfer technology from control studies to actual applications.
Ongoing research at CIGMAT is funded by federal, state and local agencies and industries. CIGMAT is currently working on a U.S. Department of Energy (DOE) funded project which entails developing smart cement and drilling mud for real-time monitoring of oil well installation and performance during the service life. Also, several systems to monitor the performance of the cement sheath embedded between the casing and geological formations are in development. Additionally, research is ongoing for developing a new microbial fuel cell to recycle hydraulic fracturing fluids.
CIGMAT organizes an annual conference and exhibition entitled Infrastructures, Energy, Geotechnical, Flooding and Sustainability Issues Related to Houston & other Major Cities, which takes place the first Friday in March. At this event, speakers are invited from major cities, transportation authorities and energy industries around the country to present and discuss projects and problems related to construction, maintenance and rehabilitation issues. The conference also discusses technical issues related to the maintenance and rehabilitation of water and wastewater systems, nondestructive testing methods, oil wells and pipelines, hydraulic fracturing, and the development of smart materials for various applications. The discussion also includes many geotechnical topics related to expansive clays, rapid construction of deep foundations and ground faulting. The proceedings of the past 17 conferences are posted on the CIGMAT website, http://cigmat.cive.uh.edu.
Smart cement modified with nanoparticles
There are two separate studies performed on oil well blowouts in the U.S. coastal area. One was conducted between the years of 1971 to 1991, and the other from 1992 to 2006, before the Deepwater Horizon Explosion in the Gulf of Mexico in 2010. These two studies identified cement failures as the major cause for blowouts. Cementing failures increased significantly during the second period of study, when 18 of the 39 blowouts were due to cementing problems. Additionally, 11 fatalities of the 2010 Deepwater Horizon Explosion resulted from cementing issues.
Due to some of the reported failures combined with a growing interest of environmental and economic concerns in the oil and gas industry, the integrity of the cement sheath is of major importance. At present, there is no technology available to monitor the cementing operation in real-time from the time of placement through the service life of the borehole. Also, there is no reliable method to determine the length of the competent cement supporting the casing.
Better controls during well drilling and cementing operation are critical to ensuring safety during the construction and throughout the service life of the wells. For a successful cementing operation, determine the setting of cement in place length of cement supporting the casing and performance of the cement after hardening. There are currently no technologies available to monitor the cementing operations without using buried sensors that could weaken the cement sheath.
In this study, smart cement, developed at CIGMAT over the past two years, was modified with nanoparticles (iron (NanoFe) and calcium carbonate) to have better sensing and contamination resistive properties. The purpose of the modification is to allow the smart cement’s behavior to be monitored at various stages of construction, as well as during the service life of wells.
A series of experiments evaluated the smart cement behavior, with and without nanoparticles, in order to identify the most reliable sensing properties, which can also be monitored with relative ease. Tests were performed on the smart cement from the time of mixing to the time of hardened state behavior. When cement was modified with 0.1 percent of conductive filer (CF), the piezoresistive behavior of the hardened smart cement was substantially improved without affecting the rheological or setting properties of the cement. For the smart cement, the resistivity change at peak stress was approximately 2,000 times higher than the change in the compressive strain, after 28 days of curing.
Compressive behavior
Nano Iron
Strength
Curing time
One day: The average compressive strengths (sc) of the cements with 0 percent, 0.5 percent, and 1 percent NanoFe, added after one day of curing, were1585 psi, 1694 psi, and 1995 psi, representing a 7 percent and 26 percent increase due to the addition of 0.5 percent and 1 percent NanoFe, respectively, as shown in Fig. 1 and Fig. 2a.
28 days: The average compressive strength of smart cement modified with 0 percent, 0.5 percent, and 1 percent NanoFe after 28 days of curing were 2810 psi, 3035 psi, and 4000 psi, respectively, representing an 8 percent and a 42 percent increase due to the addition of 0.5 percent and 1 percent NanoFe, respectively, as shown in Fig. 1 and Fig. 2b.
Piezoresistivity
Curing time
1 day: The piezoresistive behavior of cement as shown in Fig. 1. The piezoresistivity at failure, after 1 day of curing, was 0.7 percent. The addition of 0.1 percent CF to the cement with w/c ratio of 0.38 increased the change in electrical resistivity of oil well cement at failure by 583 percent, as summarized in Table 5. The addition of 0.5 percent and 1 percent NanoFe to the smart cement after 1 day of curing increased the electrical resistivity at failure by 618 percent and 700 percent, respectively, as summarized in Table 5. The piezoresistivity at failure for 1 percent NanoFe was about 3,500 times higher than the compressive strain at failure for the 0.2 percent NanoFe material sample.
28 days: The addition of 0.1 percent CF to the cement with w/c ratio of 0.38 increased the change in electrical resistivity of oil well cement at failure by 400 percent, as summarized in Table 5. Adding 0.5 percent and 1 percent of NanoFe to the smart cement increased the electrical resistivity at failure to 452 percent and 574 percent, respectively, after 28 days of curing, as summarized in Table 5. The piezoresistivity at failure for 1 percent NanoFe was over 2,800 times higher than the compressive strain at failure for the 0.2 percent NanoFe cement sample.
Figure1: Piezoresistive behavior of oil well cement with curing time.

Figure 2: Piezoresistive behavior of smart cement modified with NanoFe after: (a) one day and (b) 28 days of curing time.

 Nano Calcium Carbonate (NCC)
In another study, the effect of adding 1 percent of nano CaCO3 (NCC) on the smart cement was investigated to protect the smart cement against oil based mud (OBM) contamination. Several tests were performed to monitor the changes of the smart cement behavior with 3 percent OBM contamination, and also to monitor how NCC can improve the properties of the contaminated smart cement. Variation of electrical resistivity of the smart cement with curing time was monitored from the initial time of mixing to 28 days of curing under water. Adding 1 percent NCC to the smart cement reduced the initial resistivity from 1.07 Ω.m to 0.85 Ω.m, a 21 percent reduction, but the addition increased the compressive strength by over 50 percent.
Also, the addition of nano CaCO3 increased the rheological properties of the cement. With 3 percent OBM contamination, the viscosity of the cement slurries increased. Results showed that contamination of smart cement with OBM reduced the long-term resistivity of the smart cement, but adding NCC enhanced the electrical resistivity of the contaminated smart cement cured under water. The compressive strength of the smart cement, contaminated with 3 percent of OBM, decreased by 44 percent and 3 percent, respectively, after one day and 28 days of curing. The addition of NCC improved the compressive strength of the 3 percent OBM contaminated smart cement by 72 percent and 10 percent, respectively, after one day and 28 days of curing under water.
In order to evaluate the piezoresistive behavior of the smart cement, 0.075 percent BOWC of CF was added to the cement to enhance its piezoresistive behavior. Results showed that change in resistivity at compressive failure for the smart cement was over 1,000 times more than compressive strain, and the addition of 1 percent NCC further enhanced the compressive strength by about 3 percent after one day, and 28 percent after 28 days of curing under water. The OBM contaminated smart cement showed reduced piezoresistivity at maximum compressive stress at failure than the smart cement, but addition of 1 percent of NCC enhanced the piezoresistivity of OBM contaminated smart cement.
One day curing:
(a) Smart Cement: As shown in Figure 3, after one day of curing, the piezoresistivity of the smart cement was 375 percent. Parameters p and q for the model were 0.15 and 0.57, respectively.
(b) NCC Modified Smart Cement: Adding 1% of NCC enhanced the piezoresistivity of smart cement at peak stress to 514 percent, a 37 percent increase after one day of curing. The p-q model parameters p and q for the modified cement with 1 percent of NCC were 0.40 and 0.67, respectively.
(c) Contaminated Smart Cement: As shown in Figure 3, contamination of the smart cement with 3 percent of OBM reduced the piezoresistivity to 231 percent, a 38 percent decrease. The p-q model parameters p and q for the 3 percent OBM contaminated smart cement were 0.27 and 0.49, respectively.
(d) Contaminated NCC Modified Smart Cement: Adding 1 percent of NCC improved the piezoresistivity of the contaminated cement with 3 percent of OBM by 38 percent to 319 percent after one day of curing under water. The p-q model parameters p and q for the 3 percent OBM contaminated cement modified with 1 percent of NCC were 0.40 and 0.39, respectively.
28 days curing:
(a) Smart Cement: As shown in Figure 3, after 28 days of curing, the piezoresistivity of the smart cement was 204 percent. The parameters p and q for the model were 0.13 and 0.40, respectively.
(b) NCC Modified Smart Cement: Adding 1 percent of NCC improved the piezoresistivity by 28 percent to 260 percent after 28 days of curing under water. This enhancement in piezoresistivity is due to microstructure enhancement of the smart cement. The p-q model parameters p and q were 0.069 and 0.29, respectively.
(c) Contaminated Smart Cement: As shown in Figure 4, 3 percent of OBM contamination reduced the piezoresistivity of the smart cement to 154 percent, a 25 percent decrease. The p-q model parameters p and q were 0.058 and 0.31, respectively.
(d) Contaminated NCC Modified Smart Cement: Adding 1 percent of NCC improved the piezoresistivity of smart cement when contaminated with 3 percent of OBM by 45 percent to 221 percent after 28 days of curing under water. The p-q model parameters p and q were 0.019 and 0.14, respectively.
Figure 3: Piezoresistive behavior of the smart cement with and without 1 percent of NCC modification after one day and 28 days of curing.

Figure 4: Piezoresistivity behavior of the 3% OBM contaminated smart cement with and without one percent of NCC modification after one day and 28 days of curing.

Small model test simulating oil wells
Also in this study, small physical oil well models were designed, built and used to demonstrate the concept of real-time monitoring of the flow of smart drilling mud, and smart cement and hardening of the cement sheath in place. The model was built using a Plexiglass and metal pipe, as shown in the Figure 5, to simulate the formation and casing. The casing was instrumented with electrical wires to monitor the resistance change. The distance between two sensors was four to 6-inches, and there were six levels of sensors, as shown in the Figure 5. Additionally, a new method has been developed to monitor the electrical resistivity of the materials using the two probe method. Based on the test results, it has been proven that resistivity dominates the behavior of drilling mud and smart cement. LCR meters, measures the inductance (L), capacitance (C) and resistance (R), were used at 300-kHz frequency to measure the changes in resistance. The horizontal electrical wire leads (sensors/monitors) are noted as a, b, c or d. The vertical wire leads are marked by 1 to 6.
Figure 5: Laboratory scale oil well model and monitoring system.

Results and Discussion
The drilling mud was placed in the model from the pressure chamber, as shown in the Figure 6. The electrical resistances of different combinations of sensors were measured at each level to determine the effect of the drilling mud as more mud was added to the annulus. After measuring the resistance for all seven levels, the drilling mud was gradually replaced by 10-liter of spacer fluid by applying pressure of around 20-psi from the pressure chamber. The same procedure was followed for the spacer fluid as was performed with the drilling mud in order to measure the resistance when the spacer fluid reached each level. The spacer fluid was displaced be the cement slurry using a pressure of 20-psi from the pressure chamber.
Installation
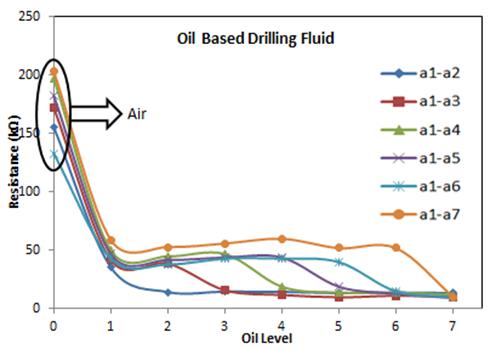
During the monitoring of drilling fluid, resistance was measured for different vertical levels in the small well model with time, as shown in Figure 7. When there was no fluid in the well (at 0 level of the casing), the resistance was in the range of 155 to 205 kΩ, which represented the air resistance for the particular distance monitored at the relative humidity of the laboratory. When the oil-based mud level rose to level one, all of the vertical resistances started to decline to the 35 to 60 kΩ range. This sudden change clearly showed that oil based mud reached level one. Similar reductions in electrical resistances were observed with horizontal measurements.
When the oil-based mud reached level two (as observed through the Plexiglass model), the sensors a1-a2 (resistance in the vertical direction between levels one and two) showed a sudden change in the electrical resistance — its resistance dropped from approximately 36 kΩ to 14 kΩ. The change occurred because the drilling mud, with a resistivity of 110 Ω.m, filled space the be tween levels one and two. The same pattern was also observed for the other sets of readings. This consistent behavior showed the level of the drilling fluid can be monitored effectively by measuring the resistance.
Figure 6: Experimental Setup of small model where cement is displacing Spacer Fluid.

Figure 7: Vertical resistance measurements for the oil based drilling fluid, (b) monitoring the spacer fluid.
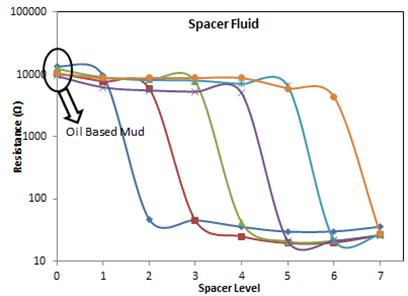
Monitoring the spacer fluid:
In order to monitor the spacer fluid, the same procedure used to monitor the drilling fluid was followed. As shown in Figure 8, the changes in the resistance readings for the spacer fluid. When the spacer fluid filled the annuli, the resistance rapidly declined due to the lower resistivity of the spacer fluid.
Figure 8: Vertical resistance measurements for spacer fluid, (c) monitoring the cement slurry.
Monitoring the cement slurry:
After completely filling the model with the spacer fluid, it was displaced by the cement slurry. The same procedure was followed, and Figure 9 shows the resistance readings for the cement slurry as a function of vertical level.
Figure 9: Vertical resistance measurements for cement slurry.

Figure 10 shows the resistance change with time in the well for different types of the test fluids. Air resistance initially dropped to the oil based drilling mud’s resistance, and it was followed by a decline in resistance representing the spacer fluid and increase due to cement slurry.
Figure 10: Vertical resistance measurements in the oil well model.

Microbial Fuel Cell (MFC) for recycling hydraulic fracturing fluids
To meet energy needs, the development of unconventional, onshore natural gas resources in deep shale is rapidly expanding in Texas (Eagle Ford, Barnett, Haynesville-Bossier) and many parts of the U.S. (Marcellus, Fayetteville, Niobrara). In the U.S. about 35,000 wells are hydraulically fractured annually (API 2010).
Water management has emerged as a critical issue in the development of these inland gas reservoirs, where hydraulic fracturing is used to liberate the gas. Each well may require as much as two to 12 million gallons of water (Myers 2008).
Following hydraulic fracturing, large volumes of water containing very high concentrations of total dissolved solids (TDS) and oil return to the surface. The TDS concentration in this wastewater, also known as flowback, can reach five times that of sea water. Wastewaters that contain high TDS levels are challenging and costly to treat. Current technologies such as electro-coagulation (EC) and dissolved air floatation (DAF) have many limitations (Gregory et al. 2011; Rodrigues et al. 2006). Economical production of shale gas resources will require creative management of flowback to ensure protection of groundwater and surface water resources. Currently, deep-well injection is the primary means of management. However, in many areas where shale gas production will be abundant, deep-well injection sites are not available. With global concerns over the quality and quantity of fresh water, novel water management strategies and treatment technologies, which will enable environmentally sustainable and economically feasible natural gas extraction, will be critical for the development of this vast energy source.
The overall objective of this study is to develop an environmentally sustainable Microbial Fuel Cell (MFC) technology not only to rapidly treatment the wastewater from hydraulic fracturing, but also to recycle and reuse the treated water. Taking advantage of the oxidation and reduction conditions in the anode and cathode chambers, the study will develop a free standing MFC to do the entire treatment. The schematic diagram of the proposed MFC treatment with the necessary inputs and outputs are shown in Figure 11.
Figure 11: Proposed MFC for treating contaminated wastewater from hydraulic fracturing.


Conclusion
CIGMAT research studies are focused on developing smart materials for various applications including drilling, oil well cementing and hydraulic fracturing. Studies are also focused on corrosion, physical modeling of pipe-soil interaction by simulating ultra deep water conditions, chemical resistance of cementitious materials, and behavior of coating materials when used as insulators of oil pipelines. The effects of various types of nanoparticles on the performance of material and microbial fuel cells are being investigated.
The 2016 CIGMAT Conference and Exhibition will be held on March 4, 2016. Conference updates can be found at http://cigmat.cive.uh.edu.

Comments